Cryptocurrency Tracker in Google Sheets
How to Make an Automatically Updating Cryptocurrency Portfolio In Google Sheets
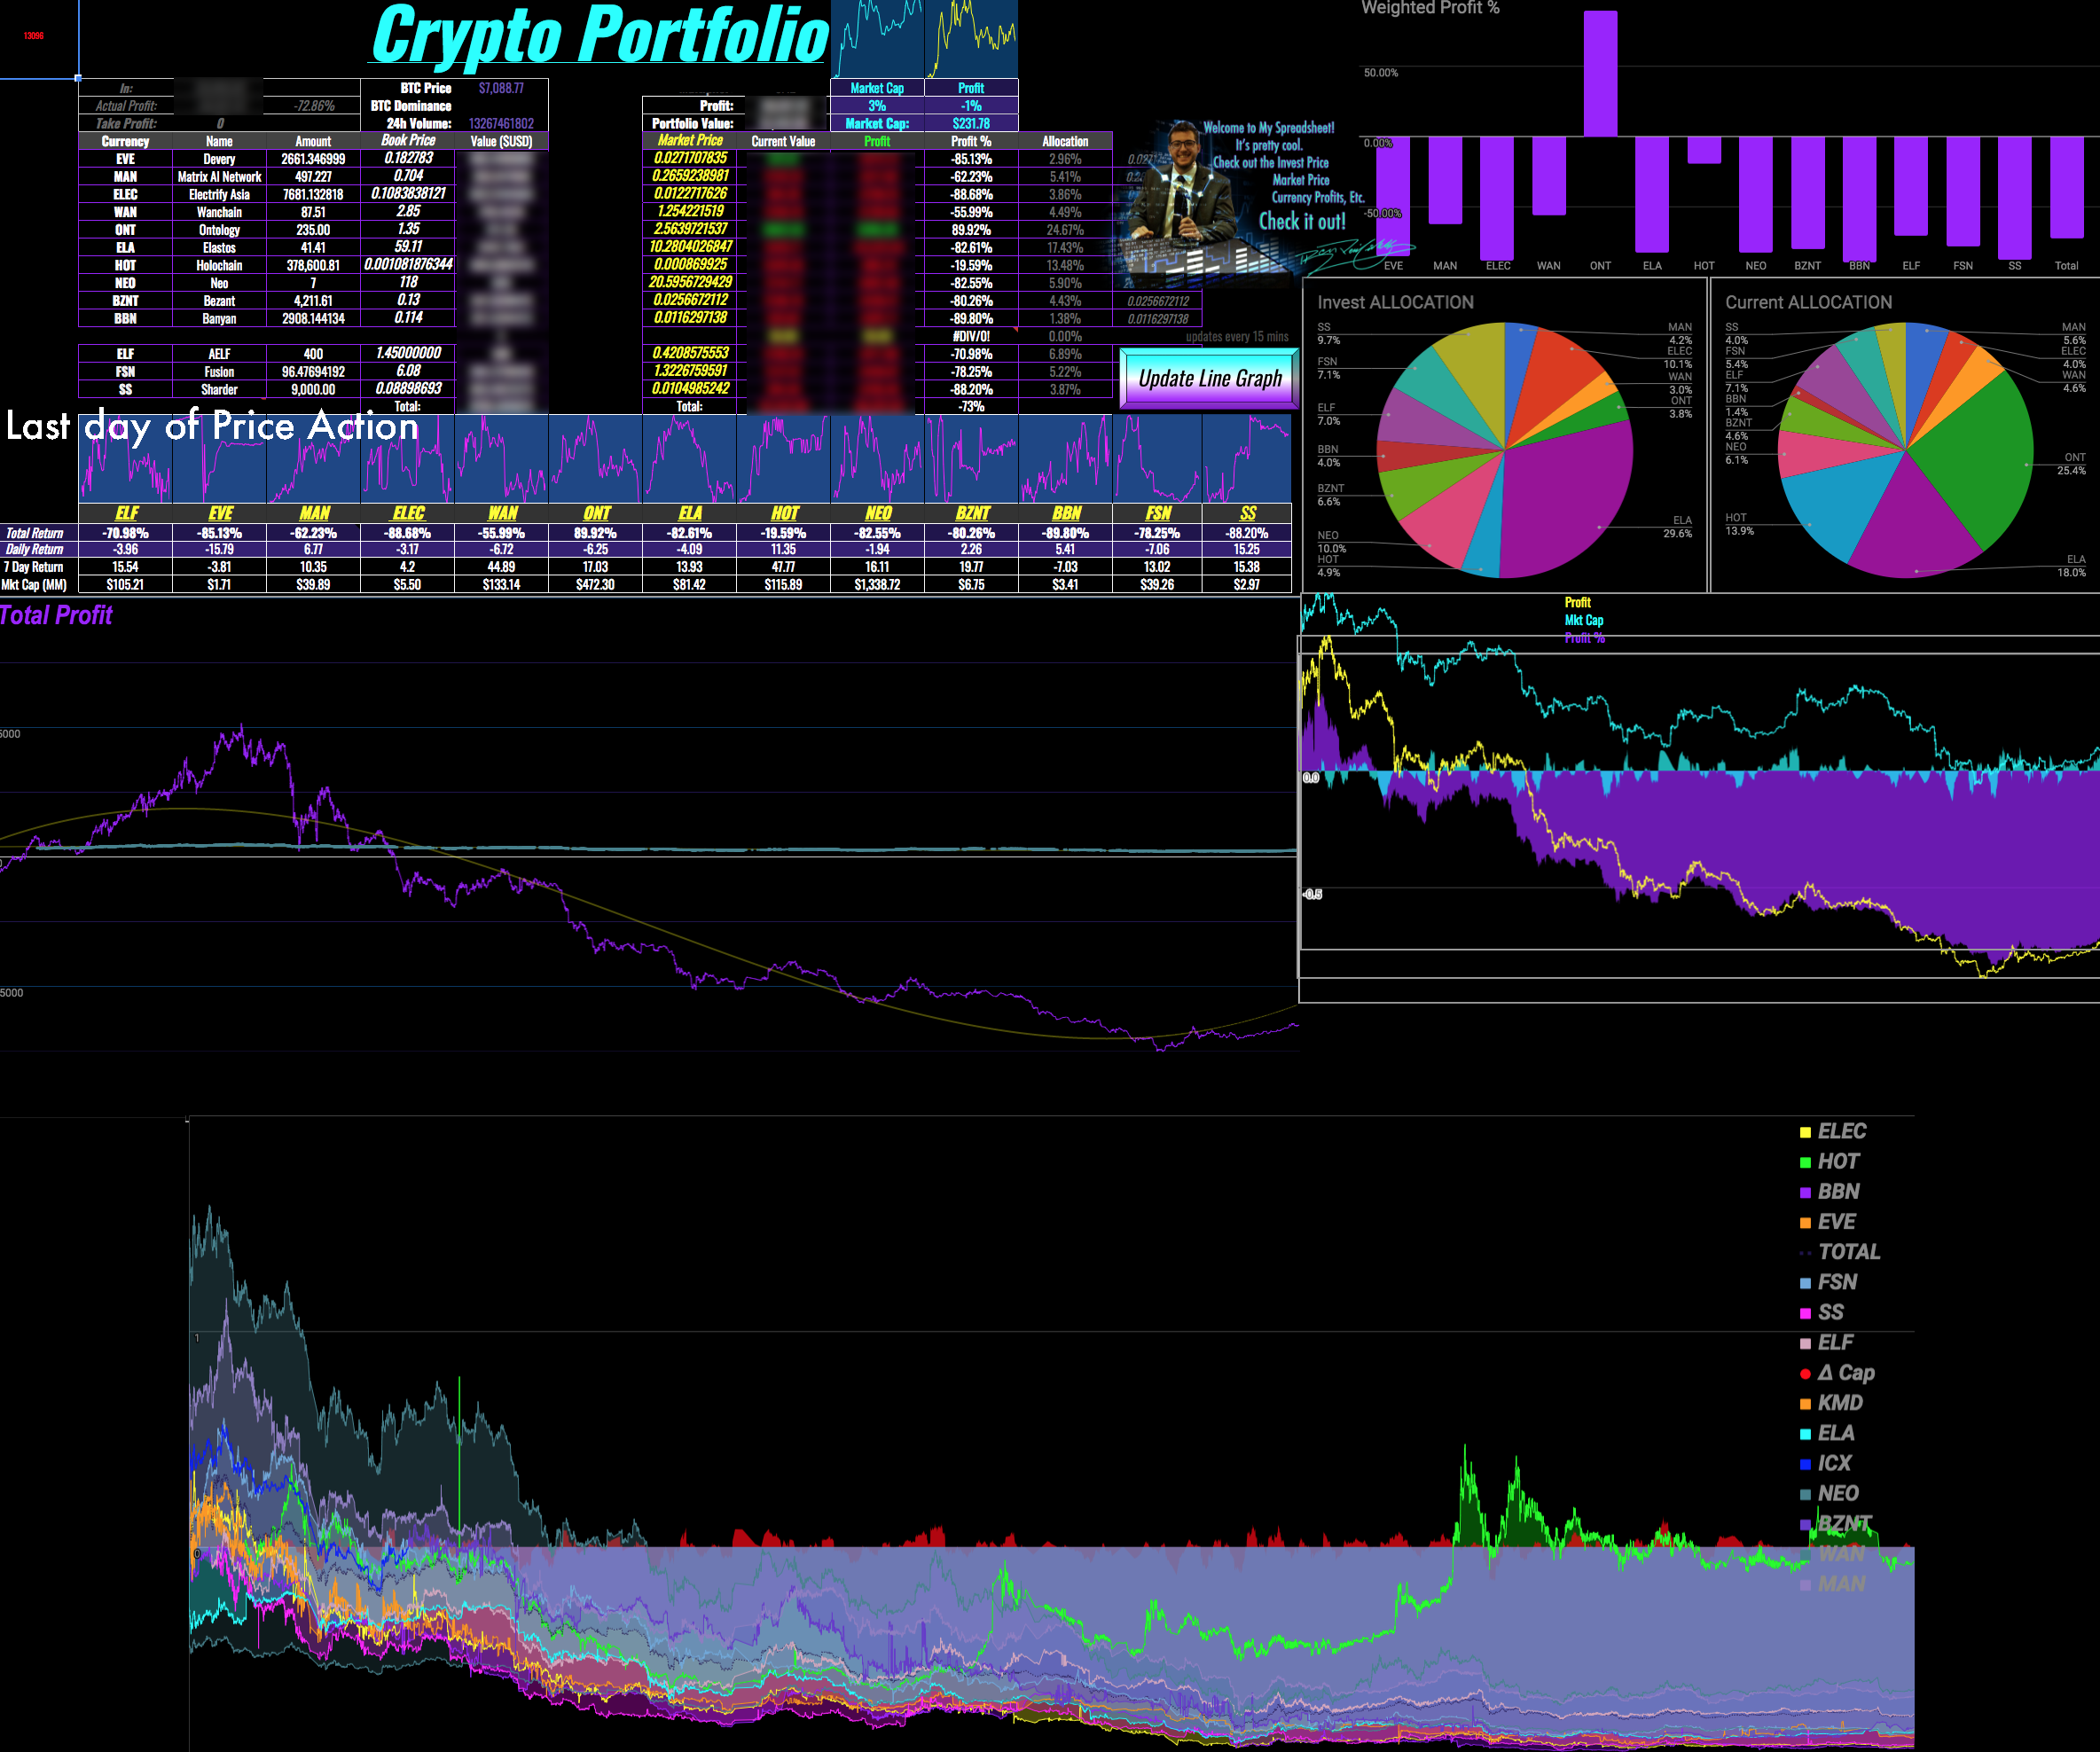
I made a crypto portfolio template in google sheets with automatic live updating market prices. Make sure to download crpytofinance before trying to use the template: https://t.co/UcPNWuzUet
— Ben Percifield (@PenBercifield) April 5, 2018
The video attached is a demonstration of how to use it after making your own copy! pic.twitter.com/WEroqs8TBY
I taught myself how to code a javascript macro to get market prices and update a spreadsheet in realtime
It really was not that difficult and in this post I'll walk you through
- How I did it
- How you can do it
- Lessons Learned
1. How I did it.
The first version I created uses the plug-in cryptofinance to get live market values.
The function, increaseLine() is called every 15 minutes to print a new row.
function increaseLine()
{

  var sheet1 = SpreadsheetApp.getActiveSpreadsheet().getSheetByName("PORTFOLIO");
  var sheet2 = SpreadsheetApp.getActiveSpreadsheet().getSheetByName("Currency Profits");
  SpreadsheetApp.setActiveSheet(sheet1);
  modifyCell("A1", true, "I3", "J7", "J8", "J9", "J10","J11","J12","J13","J14","J15","J16","C20","K4","J17","I2", "H18", "H19","J3");
  updateSpark();
  updatePercents();
  SpreadsheetApp.setActiveSheet(sheet2);

}
The line graphs automatically update as they are referencing a row, not a specific set of values.
2. How you Can Do It.
Check out this video for long-form tutorial:
Check out this tweet for short-form Tutorial
And this template
3. Lessons Learned
The further I took this, the further I developed it. I learned about Sparklines, which can make a line graph in a single cell for up to 100 values. 15 minutes * 100 = 1500 minutes, 1440 minutes in a day, which gave me the last day of action for a given trackable asset: